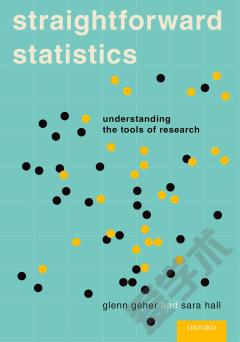
Straightforward Statistics —— Understanding the Tools of Research
----- 简明统计学:了解研究工具
Preface 1: Why Do I Need to Learn Statistics? - Examples of statistics in the real world - The nature of findings and facts in the behavioral sciences - Descriptive and Inferential Statistics - A conceptual approach to teaching and learning statistics - What you should get out of this class 2. Describing a Single Variable - The nature of variables: continuous vs. categorical - Frequency distributions as descriptions of single variables - Creating frequency distributions - Representing frequency distributions graphically - Interpreting frequency distributions - Mean, median, and mode - Why is the mean the most-utilized index of central tendency? - The conceptual elements of standard deviation - Computing standard deviation 3. Standardized Scores - Why are standardized scores needed in the real world? - Why are standardized scores needed in statistics? - Computing Z scores - Interpreting Z scores - A real research example - Summary 4. Correlation - Real-world examples of correlations - Representing correlations graphically (the scatterplot) - Representing correlations quantitatively (Pearson's r: an index of correlation strength and direction) - Computing r using Z-scores - Interpreting r (what you can and cannot conclude knowing that a correlation between two variables exists) - A real research example - Summary 5. Statistical Prediction and Regression - The basic rationale underlying regression - Standardized model of bivariate regression - Raw-score model of bivariate regression - The regression line - Estimating error of prediction - Basic rationale underlying multiple regression - A real research example - Summary 6. The Basic Elements of Hypothesis Testing - Probability - The normal distribution - Estimating likelihood of outcomes - A real research example - Summary 7. Introduction to Hypothesis Testing - Basic rationale underlying hypothesis testing - What is meant by statistical significance? - The five steps of hypothesis testing: - Stating the null and research hypotheses - Delineating the nature of the comparison distribution - Determining alpha (by defining a part of the comparison distribution is highly unlikely) - Comparing a sample from the special population with the comparison distribution - Commenting on the null hypothesis - A real research example - Summary 8. Hypothesis Testing if N > 1 - The basic steps of hypothesis testing always remain the same - The comparison distribution needed for comparing a sample mean: The distribution of means - Hypothesis testing using the distribution of means - Confidence intervals - A real research example - Summary 9. Statistical Power - Defining Power (p(rejecting the null hypothesis when the research hypothesis is true) and Beta (p(Type-II error)) - How N, population-level standard deviation, and effect size affect power - Computing power - How power affects real research - A real research example - Summary 10. t-tests (One-Sample and Within-Groups) - How a t-test differs from a Z-test - The nature of the t-distribution (and why it varies as it does) - Computing a one-sample t-test - Computing a repeated-measures t-test - A real research example - Summary 11. t-tests: Between-Groups - The basic rationale of the between-groups t-test - Computing the between-groups t-test - Interpreting results - A real research example - Summary 12. Analysis of Variance - Basic reasoning of F as a ratio between effect and error variance - Concepts underlying a one-way ANOVA - Computing a one-way ANOVA - Factorial ANOVA - What results from an ANOVA can and cannot tell you - Post-hoc tests - A real research example - Summary 13. Chi-Square - What happens when all our variables are categorical? - Basic rationale underlying goodness of fit test - Computing the chi-square goodness of fit - Computing the chi-square test of independence - Interpreting chi-square results - A real research example - Summary Appendix A: Normal Curve (Z) Table Appendix B: t Table Appendix C: F Table Appendix D: Chi Square Table Appendix E: Advanced Statistics You May Run Into - Factor Analysis - Multiple regression - Structural Equation Modeling - Repeated-Measures ANOVA - Mixed-Design ANOVA - MANOVA Appendix F: Using SPSS to Compute Basic Statistics - Benefits of SPSS - Different kinds of SPSS files - Entering data with SPSS - Computing frequency distributions with SPSS - Describing variables with SPSS - Using SPSS to examine correlations - Using SPSS for a repeated-measures test - Using SPSS for a between-groups test - Using SPSS for a one-way ANOVA Glossary Answers to Set B Homework Problems References Index
{{comment.content}}



 京公网安备 11010802027623号