斯坦福大学
哥伦比亚大学
麻省理工大学
哈佛大学
芝加哥大学
普林斯顿大学
耶鲁大学
加州大学伯克利分校
康奈尔大学
牛津大学
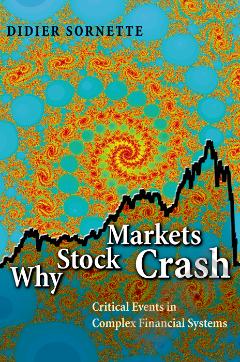
Why Stock Markets Crash —— Critical Events in Complex Financial Systems
----- 为什么股市崩溃:复杂金融体系中的关键事件
ISBN: 9780691175959 出版年:2009 页码:441 Sornette, Didier Princeton University Press
The scientific study of complex systems has transformed a wide range of disciplines in recent years, enabling researchers in both the natural and social sciences to model and predict phenomena as diverse as earthquakes, global warming, demographic patterns, financial crises, and the failure of materials. In this book, Didier Sornette boldly applies his varied experience in these areas to propose a simple, powerful, and general theory of how, why, and when stock markets crash. Most attempts to explain market failures seek to pinpoint triggering mechanisms that occur hours, days, or weeks before the collapse. Sornette proposes a radically different view: the underlying cause can be sought months and even years before the abrupt, catastrophic event in the build-up of cooperative speculation, which often translates into an accelerating rise of the market price, otherwise known as a "bubble." Anchoring his sophisticated, step-by-step analysis in leading-edge physical and statistical modeling techniques, he unearths remarkable insights and some predictions--among them, that the "end of the growth era" will occur around 2050. Sornette probes major historical precedents, from the decades-long "tulip mania" in the Netherlands that wilted suddenly in 1637 to the South Sea Bubble that ended with the first huge market crash in England in 1720, to the Great Crash of October 1929 and Black Monday in 1987, to cite just a few. He concludes that most explanations other than cooperative self-organization fail to account for the subtle bubbles by which the markets lay the groundwork for catastrophe. Any investor or investment professional who seeks a genuine understanding of looming financial disasters should read this book. Physicists, geologists, biologists, economists, and others will welcome Why Stock Markets Crash as a highly original "scientific tale," as Sornette aptly puts it, of the exciting and sometimes fearsome--but no longer quite so unfathomable--world of stock markets.
It's an interesting thesis, that systems, pre-crash, exhibit log periodic power law (LPPL) behavior. In other words, they accelerate at faster than exponential increase, and impose on that oscillations whose period is not constant, but logarithmically increasing. Intuitively, it makes sense. I have been investing for many years and I know from experience to beware investment "melt-ups" because a crash is imminent. This book, however, reads more like someone's PhD thesis, where the author is trying to prove his ideas rather than explain them. It also draws too much on previous work in the field without explaining it, so it's very much an insider's book. I did, however, appreciate the early and last chapters that examine crashes in general, and found them the most interesting. The book was written around the year 2000, so it missed the "fun" around 2008. I would have liked to have seen how the ideas in the book predicted or analyzed those events. The very last chapter in the book was odd, to say the least. I'm still not sure what to make of it.
This is a great book that applies physics and maths to the financial system ( and financial theories), building up a model that mathematically explains the boom and burst (or soft landing) of bubbles. Not an easy book to follow if you donât have any base in economy/finance/math.
The author discusses the application of non-linear modeling techniques on the financial market. Given the behavior of financial market is the result of the inter-working of countless investors, it's very surprising and interesting to see these modeling techniques actually produce some very good results. In particular, the author presents the logic behind the formation and the bursting of bubbles, and, more importantly, provides insight of what we can expect from the financial market in the long term. Please note this is a very technical book for the general public. You don't need a PhD to understand it, but you do need to be comfortable with data plots and discussions of equations. You also need more than a general understanding of statistics; concepts such as correlation, regression, and model fit should not be intimidating to you. Some background in Physics will also be helpful, especially if you already understand the equation of oscillatory motion.
Do not buy this as an e-book; a couple of Princeton e-books on mathematical subjects that I've bought had bad misprints in the equations. I read the paperback. Stock-market crashes generally take everyone by surprise--they feel like bolts from the blue. They're usually not. Sornette shows how the interplay of greed, fear, and imitation among investors and traders creates an accelerating rhythm of sudden rises alternating with increasingly brief pauses. This "mathematical signature" can begin months or years in advance, but its predictive value rises in the last year before the death of the bubble (which may be relatively calm, but usually is followed by a crash). Sornette presents the results of several predictions made using this technique. While his track record is not perfect, it is strongly better than what could be expected from chance. Although the math is advanced, the discussion and the graphs make the argument clear to the lay reader. What about the everyday investors who donât have access to Sornetteâs computational skills? The lesson is straightforward: as markets rise, and especially as they rise sharply, so does the danger of a crash. As they watch a sharp rise, investors should reduce their equity positions to capture gains made so far and limit the danger to their portfolios. But let's assume that you're not in the stock market and don't plan to be. The last chapter broadens the discussion to consider a wide range of problems confronting the world in the period from the year of publication (2002) to the potential "end of the growth era" around 2050. Many of the trends described have only become more pressing since 2002. This book is both important and fascinating--not just for investors but also for citizens of an uncertain world.
This is a fascinating book, both on finance and many other complex phenomena. I have now read it three times. It appears he has made a genuine advance in understanding financial bubbles and crashes. However reading the book does require that you are prepared to think. If you are after someone telling you what to buy or sell, this is not the book for you. Yes there is some math but you really can skip it without losing too much. The quotes that people have included in their reviews are minor asides that merely point the interested to further related material. Some others have commented that his predictions have not all worked out. This is all discussed at length in the book; in such a field predictions are not infallible. About 40% of market crashes are caused by external events and so are not predictable. However he seems to have the S&P500 worked out. Last years he predicted a choppy rally in 1Q2003, then from 2Q2003 a major fall ending in 1h2004. So far so good.
Why Stock Markets Crash by Didier Sornette is an interesting book. He is a geophysicist who specializes in predicting failures in complex systems. The book contains some rigorous mathematical proofs for a 'popular' book which means it probably won't be popular. But even if one merely glances the math, which again is mostly for proofs and for those with an analytical inclination, the overall text and thoughts and analysis are extremely thought provoking and insightful. Its really good. You should read it if you have a background in stats or finance and are interested in the theory of efficient markets and the occurence of 'secular' events.
The book doesn't have a central idea but touches and references many inter-disciplinary areas of science and economics, to come attempt to model about social, economic and stock market behaviour in a more objective, long-term way. It is full of interesting notions and observations, but fails to make any central point. In fact, stock markets are the least discussed subject of the book! As is the case with much scientific contribution to investment lore, it doesn't propose any actionable methods for improving investment. Rather, it lays out a wide range of possible scenarios including the possible collapse of society and economy due to overpopulation etc, with the result that after reading the book, one is inclined to think that stock markets and investing really aren't that important and we should probably buy a farm and worry about the end of the world as we know it!! The other issue with the book is it's quite technical and hard to read for laymen. Still interesting ideas, if not fully formed.
Das Wichtigste zuerst: -das Buch bereitet mir groÃen Spass . Man bekommt viel "Populärwissenschaftliches" aus spannenden und interessanten Feldern wie Experimentelle Psychologie/Behavioural Finance, Complexity Science und Dynamische Systemtheorie (und ihren Anwendungen in der Soziologie, Biologie...etc). Eine wahre "Enzoklopädie" vergangener Chrashes (aber eine rein empirische Betrachtung...keine Wirtschaftspolitische/Ãkonomische Interpretation), geschmückt mit Aussagekräftigen Abbildungen. - ob das so wirklich Sinn macht, was der Herr Sornette da veranstaltet, weià ich nicht so wirklich. Praktischen Nutzen hat das Buch eher nicht. Aber es erweitert den Horizont. - die 5 Sterne sind meine persönliche Meinung. Ich bin diesbezüglich etwas "biased". Ich finde es einfach spannend, wenn es um das Disziplinübergreifende Feld der Comlexity/Dynamic System Theory/Evovlving Systems und seine Helden wie Per Bak, Doyne Farmer und Norman Packard etc geht. Da werde ich eher zum Fan, als zum kritischen Betrachter:)... so take this review with a grain of salt. Nun zur eigentlichen rezension: Erstmal gilt es zu betonen: Sornette ist echter Wissenschaftler. Geo-Physiker an der UCLA und Mitglied des ETH Risk Labs (wo sich auch andere GröÃen wie Embrechts tummeln). Er ist ein Fachmann auf dem Gebiet das man als "Self-organized criticality" bezeichnet, eine spezieller Vertreter der Dynamischen Systeme. Das ist so an sich unter Wissenschaftlern wohl nicht ganz unumstritten, aber faszinierend sind die daraus enstehenden Ideen allemal. Die Idee lässt sich mal gaaaanz grob und stark verkürzt so beschreiben. Ein komplexes System ist in seinem "Normalzustand" nicht vorhersagbar. Returns and den Kapitalmärkten lassen sich nur schwer oder gar nicht (darüber streitet man) prognostizieren. Ein solches System zeichnet sich dadurch aus, daà es aus sehr vielen "Agenten" besteht, die zueinander in Kontakt stehen und dadurch Feedback erzeugen (in letzter Konsequenz schauen alle auf einen Bildschirm mit Kursen...die sie selbst durch ihr Handeln beiflussen). Normaleweise sind diese Agenten heterogen. Es gibt "Optimisten" udn "Pessimisten". Marktteilnehmer mit kurzem und welche mit langen Anlagezeitraum, groÃer und niedriger Risikobereitschaft, manche haben mehr Information als andere etc....Spannend wird so ein System nun dann, wenn es sich beginnt zu "synchronisiert", dann wenn die einzelnen Agenten beginnen zu "clustern" und ihre Hnadeln gleichschalten. Sowas erzeugt dann eine Art viralen Effekt, die Kursbewegung werden gröÃer, die Unsicherheit steigt. Der Mensch oder Soziale Systeme an sich neigen dann zur "Immitation". Das ist NICHT dumm (auch wenn man solche Menschen in "Retail" Foren dann gerne als "Lemminge" belächelt....andererseits gilt es in den selben Foren als Weisheit sich nicht gegen den Trend zu stellen...leicht schozophren:) )! Aber der Mensch funktioniert so. Stellen Sie sich vor Sie sind auf einer groÃen Sportveranstaltung. Sie haben leicht die Orientierung verloren und wissen nicht genau wo der nächste Ausgang ist. Sie vermuten aber zu ihrer Rechten Seite. Plötzlich gibt es eine Explosion. Das Hallendach scheint einzustürzen (Sie können es nicht so genau sagen...aber Menschen schreien, es scheint eine Panik auszubrechen...). Die Menschenmassen flüchten....nach Links!!! Wie sicher sind Sie sich, daà Sie Ihre eigentliche Annahme ("Ausgang rechts") nicht nochmal überdenken würden? Schwarmbildung macht in einer Welt voller Risiko und Unsicherheit Sinn......manchmal:) Je nach "Geometrie" der Verbindungen (der Hirarchie des Systems)zwischen den Agenten, gibt es einen gewissen "kritischen" Punkt, an dem die "Cluster" groà genug sind und die ausgleichenden Agenten (die mit der anderen Meinung) einfach zum GroÃteil gleichgeschaltet werden....das System kippt und begibt sich zügig in einen anderen Zustand: ein Crash! Bei Solchen Systemen entwickelt die Hazard Rate (die Wahrscheinklichkeit, das es im nächsten Zeitschritt kippt, gegeben dem Umstand, das es nicht schon passiert ist), wenn man sie gegen die Distanz zum kritischen Punkt abbildet, ein gewisses Muster...das Log-Periodoc Pattern. Jetzt klingt das alles sehr esoterisch. Ist es aber nicht. Finanzmärkte sind nicht das einzige komplexe System. Die Theorie kommt in ganz bodenständigen Anwendungen in Wissenschaft und Ingeneurwesen zum Einsatz. Diedier Sornettes Methoden werden bei der ESA verwendet um den Zustand von Raketentanks zu überwachen. Erdbebenforschung, Materialtechnik und viele andere Felder nutzen dies Tag ein Tag aus. Sornette hat zum Thema ein wissenschaftlicehes Buch geschrieben
Der Autor ist gelernter Geophysiker und der bekannteste/umtriebigste Econophysiker. In der Econophysik werden Physikalische Modelle auf die Ãkonomie und im Speziellen auf das Finanzcasino angewandt. Sornette zeigt zunächst, dass der rechte Teil vieler empirischen Verteilungen einer power-low vulgo Pareto-Verteilung folgt. Eine Tatsache, die V.Pareto schon 1896 postulierte (obwohl das Buch ein Streifzug durch die Wissenschaft ist, wird Pareto aber nicht erwähnt). Die Pareto-Verteilung hat fat-tails. Die Extremwerte heben sich noch einmal von dieser Verteilung ab. Sornette nennt diese Werte King-Dragons. Betrachtet man die Verteilung der Einwohnerzahlen von französischen Städten, dann ist Paris ein King-Dragon. Crashes sind die King-Dragons der Börse. Sornette geht davon aus, dass diese King-Dragons einem anderen Phasenzustand angehören. Eine klassische Methode zur Simulation von Phasenübergängen sind Ising-Modelle [Newman,Berkema 1998]. Benachbarte Atome haben geringere Energie, wenn ihre Spins gleichgerichtet sind. Allerdings wird die parallele Ausrichtung ständig durch thermische Effekte zerstört. Es gibt eine kritische Temperatur. Oberhalb dieser Temperatur gibt es nur kleine, zufällig Inseln von parallelen Spins. Diese Inseln lösen sich auch ständig wieder auf. Bei der kritischen Temperatur kommt es zu komplexen Mustern, unterhalb richten sich die Spins fast vollständig in einer Richtung aus. Ising-Modelle erklären u.A. sehr gut den Ferromagnetismus. Sornette postuliert, dass die Händler auf einem fraktalen diamantartigen Gitter organisiert sind. Jeder Händler kommuniziert auf diesem Gitter mit seinen Nachbarn. Seine Entscheidung hängt von der Meinung der Nachbarn sowie seiner privaten Information/Einstellung ab. Das ist quasi die Händler-Temperatur. Ein Crash tritt ein, wenn die Spins der Händler kollektiv auf "sell" umkippen. Daraus folgert Sornette zwei Bedingungen für einen Crash: Die Kurse müssen Super-Exponential Wachsen (seine Definition der Blase) und es muss erkennbare Vorbeben geben. Der Begriff Vorbeben ist aus der Erdbebenforschung übernommen und daher wörtlich zu nehmen. Das Super-Exponentialle Wachstum ist durch Schwingungen mit logarithmisch zunehmender Frequenz überlagert (log-Periodicity). Der kritische Punkt ist erreicht, wenn die Frequenz der Vorbeben gegen Unendlich geht. In diesem Punkt ist die Wahrscheinlichkeit für einen Crash am höchsten. Es kann aber schon vorher, aber auch gar nicht, krachen. Sornette formuliert daher ein Modell mit 6 bzw. ein erweitertes Modell mit 8 Parametern, dass sowohl das Super-Exponentielle Wachstums als auch die log-Periodicity enthält. Da stellte sich beim Lesen meine Statistiker-Seele die banale Frage: Wie schätzt man diese Parameter? Das Buch verweist auf Papers. Ich habe mir diese vom Netz heruntergeladen. Diese Papers verweisen auf weitere Papers. Nachdem Sornette&Co eine Paper-Blase produzieren, ist man damit eine Weile beschäftigt. Am Ende ist man auch nicht viel klüger. AuÃer der Erkenntnis, dass in den meisten Papers dasselbe steht. Die im Buch mehrfach zitierten Lomb-Periodogramme funktionieren auf alle Fälle nicht. Bei der Lomb-Methode geht man - wie bei der Fourier-Analyse - von stationären Zeitreihen aus. Eine Blase ist klarer Weise nicht stationär. Man kann vorher den Blasen-Trend herausrechnen, aber das ist bei einem postulierten Super-Exponentiellen Wachstum alles andere als befriedigend. Sornette erwähnt an einer Stelle einen metaphorischen Zusammenhang mit Eliott-Waves. Ich würde sagen, auch bei Sornette finden die Schwingungen primär im Auge des Betrachters statt. Ein Modell mit 8 Parametern kann man immer so hindrehen, dass es zumindest im Nachhinein gut passt. Viel überzeugender finde ich die im Buch ebenfalls erwähnte Analyse von [Bates 1991]. Ich habe - mit freiem Auge - beim S&P-500 den Crash im Jan. 2008 und den Super-Crash im Herbst 2008 genauer angeschaut. Von Super-Exponentiellem Wachstum kann keine Rede sein. Ich kann auch keine log-Periodicity erkennen (das ist aber mit freien Auge schwer festzustellen [Press 2007]). Deutlich erkennbar ist aber ein starker Anstieg der realized-intraday-Volatility bereits vor dem Crash. Sornette hat das Financial-Crisis-Observatory (FCO) ins Leben gegerufen. Das FCO gab am 10.Juli 2009 eine dringende Erdbeben-Warnung für den Hang-Sen Index aus. Laut FCO sollte es zwischen dem 17. und 27. Juli krachen. Diese Meldung ging damals auch durch die Medien. Die Händler sind aber nicht in Panik aus ihren Häusern gelaufen. Es ist das Gegenteil passiert. Der Hang-Shen hat bis Ende Juli eine beispiellose Ralley gemacht. Zwei kleinere Knicks zwischendurch sind eindeutig innerhalb der normalen Schwankungsbreite. Es hat bis zum heutigen Tag nicht gekracht. Im letzten Kapitel lässt Sornette die Welt im Jahr 2050 untergehen. Da schlägt das Buch eindeutig in Wahrsagerei um. Ich glaube nicht, dass die Modelle von Sornette eine nennenswerte praktische Bedeutung haben. Ich habe jedenfalls nicht vor das Modell in meinem Börsenprogramm zu integrieren. Trotzdem habe ich das Buch mit sehr grossem Vergnügen gelesen. Es ist gut geschrieben und enthält eine Unzahl von interessanten Hinweisen und Ideen. Das Lesevergnügen stellt sich allerdings nur ein, wenn man von den gestreiften Wissenschaftsgebieten eine ungefähre Vorstellung hat. Zu genaue Kenntnis dürfte dem Lesevergnügen aber wieder abträglich sein. Dort wo ich wirklich verstand was der Autor sagt hatte ich den Eindruck: Sornette schlägt Schaum. [Newman,Berkema 1998]: M.E.J.Newman, G.T.Barkema: Monte Carlo Methods in Statistical Physics. [Bates 1991]: Bates D.S.: The crash of '87: Was it expected? The evidence from options markets. Journal of Finance 46, 1009-1044. Einfach, aber gut. [Press 2007]: W.H. Press et al.: Numerical Recipes, 3rd Edition, p. 687. Anmerkung: Die 5 Sterne enthalten einen Quant-Aufschlag. Man ist auf diesem Gebiet über jedes Buch das einem zum Denken anregt schon dankbar. Newman&Berkema sowie Press sind echte 5-Sterne Bücher.
Pietra miliare nell'analisi dei crash dei mercati, non si capisce come mai non sia mai stato tradotto in Italiano. Lettura dei cicli di borsa con l'analisi dei frattali.
It's an interesting thesis, that systems, pre-crash, exhibit log periodic power law (LPPL) behavior. In other words, they accelerate at faster than exponential increase, and impose on that oscillations whose period is not constant, but logarithmically increasing. Intuitively, it makes sense. I have been investing for many years and I know from experience to beware investment "melt-ups" because a crash is imminent. This book, however, reads more like someone's PhD thesis, where the author is trying to prove his ideas rather than explain them. It also draws too much on previous work in the field without explaining it, so it's very much an insider's book. I did, however, appreciate the early and last chapters that examine crashes in general, and found them the most interesting. The book was written around the year 2000, so it missed the "fun" around 2008. I would have liked to have seen how the ideas in the book predicted or analyzed those events. The very last chapter in the book was odd, to say the least. I'm still not sure what to make of it.
This is a unique book, and so I don't know that it will work as well for other people. Sornette does not hesitate to use equations, including writing down differential equations and solutions. He uses them sparingly and puts many word explanations around them, but know that if you plan to read this book Sornette is not going to skip the math. I think he does an excellent job of explaining things without the math, but I always appreciate having the equations available. For the book itself, Sornette explains the theory of log-periodicity (LPPLS, log periodic power law singularity, nowadays) in the context of the stock market. He starts with explaining the theory of randomness and the basic economics that drive stock markets and then talks about his theory of bubbles forming and how one may be able to predict them. I like this book a lot because it presents an idea, and could work well as an explanation of how creating a scientific model works. The author also admits the shortcomings in the theory and offers it as one way that can sometimes be useful. The fact that it is now about 20 years old also gives it an interesting flavor, and reading some of the cited works is worth it, as well. I'm not completely convinced of the log-periodicity claim, but it does seem plausible, and certainly worth exploration (it has, of course, been more explored in the intervening years), and using the theory to predict crashes and bubbles seems like it could give you some interesting insights or at least perspectives. I'd recommend looking for some of the critiques online, though, as well. Overall, I'm a fan of this type of explain-your-model books. Even if the model turns out not to be as accurate for the phenomena involved, it explains how you one can think through a problem, come up with some sort of solution, and ways to test it. Obviously, this process can vary a lot depending on circumstances, but seeing how someone does it always fascinates me.
The math is beyond me, but the rest is great ! Every bubble need a backbone. The backbone is on the left hand side of each bubble. It's not a backup above a previous high. It must be a sharp correction. 1998 hi/lo was the DOW backbone, supporting it for 12 years. This book shed a lot of light about the period. It's a "Red Alert" to the current situation. In Aug 2021, NDX, SPX, RE & gov debt are in bubble territory. The future is deeply unknown ==> prepare options.
The author discusses the application of non-linear modeling techniques on the financial market. Given the behavior of financial market is the result of the inter-working of countless investors, it's very surprising and interesting to see these modeling techniques actually produce some very good results. In particular, the author presents the logic behind the formation and the bursting of bubbles, and, more importantly, provides insight of what we can expect from the financial market in the long term. Please note this is a very technical book for the general public. You don't need a PhD to understand it, but you do need to be comfortable with data plots and discussions of equations. You also need more than a general understanding of statistics; concepts such as correlation, regression, and model fit should not be intimidating to you. Some background in Physics will also be helpful, especially if you already understand the equation of oscillatory motion.

隐私声明 | 电子书 | 出版社
主办单位:中国教育图书进出口有限公司
京ICP备11007853号-12  京公网安备 11010802027623号
Copyright ©爱学术平台 2021, All Rights Reserved
